
Mega Graphic
Challenge
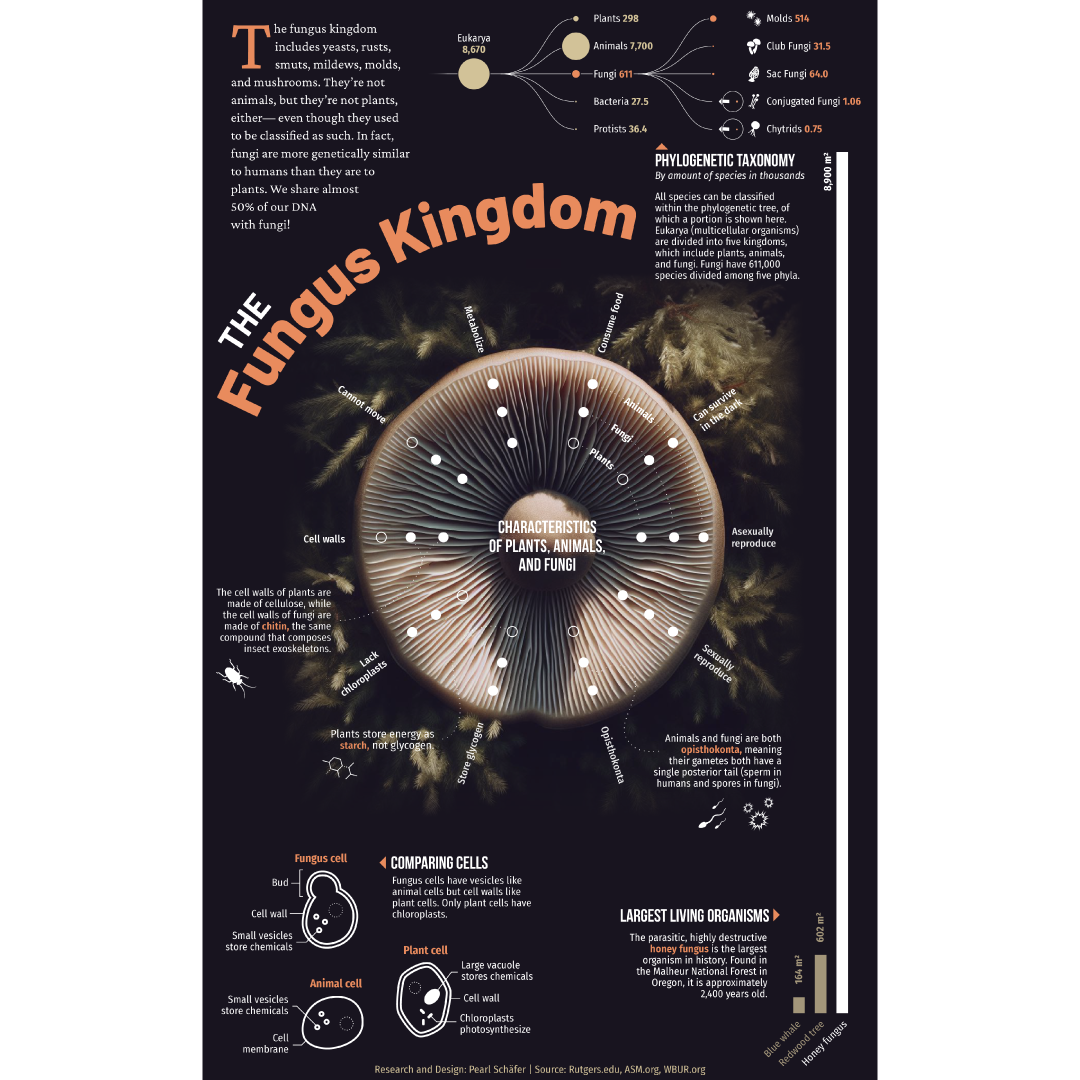
Collect data, write copy, and design for a large-print (24x36") infographic of any science-related topic. The graphic must have at least 4 data sets.
Approach
My research question was: "What exactly distinguishes the fungus kingdom from the plant and animal kingdoms?" My visual storytelling aims to share this sense of mystery while answering the question empirically.
This infographic won third place in its category for a national contest, the 25th annual Michigan State University Society of News Design (MSUSND).
Tools
Illustrator, Nano Banana, Google Sheets
Standalone Infographic
Challenge
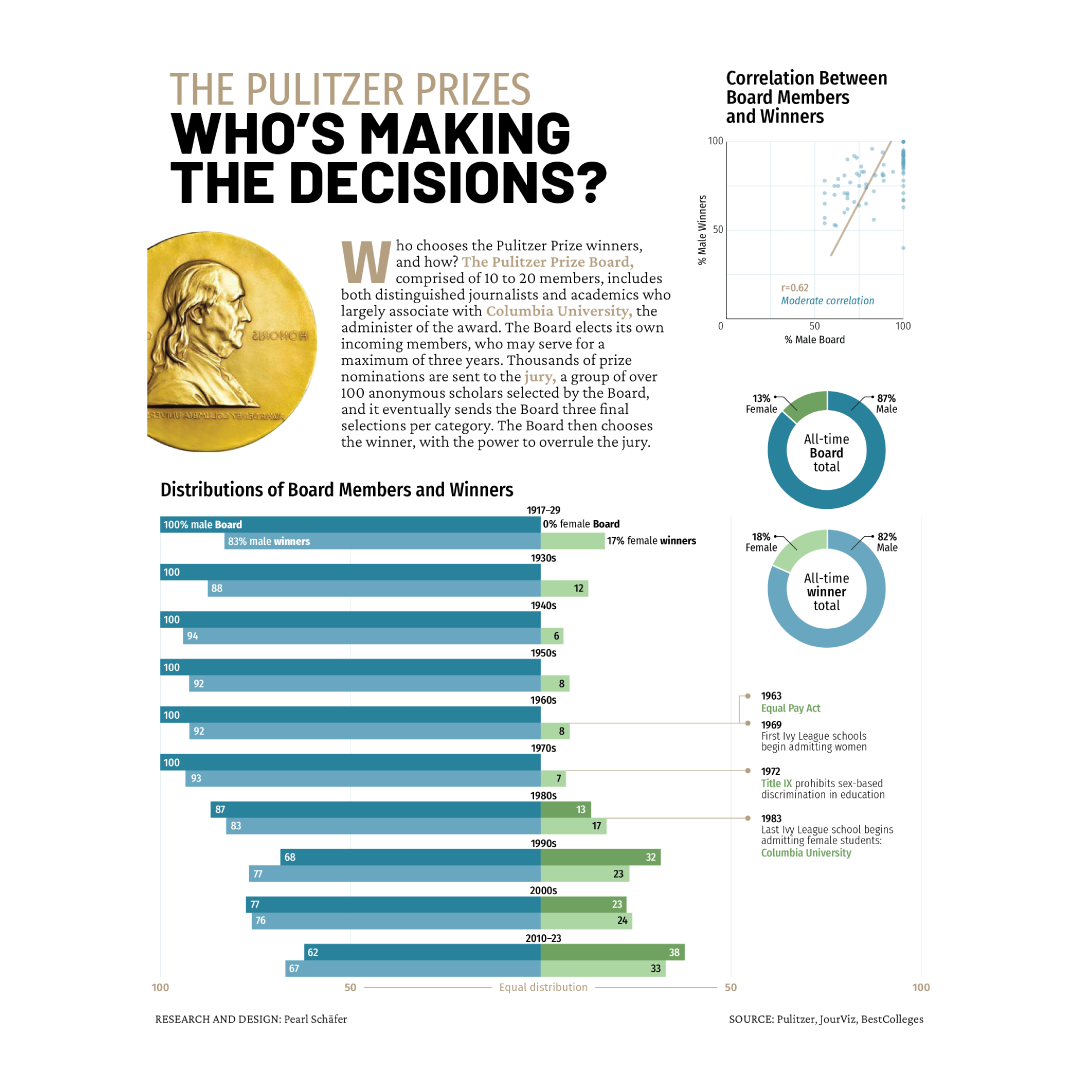
Create a print (8.5x11") infographic relating to the Pulitzer Prize. The infographic must have at least two data sets and adhere to standardized typefaces and colors.
Approach
To explore the causes behind the gender gap within the Pulitzer Prize winners, I studied the gender gap within the Pulitzer Prize Board, who ultimately choose the winners. I used the Pulitzer website to gather data, calculating how these two ratios may correlate.
Tools
Adobe Illustrator, Google Sheets

Infographic Series
Challenge
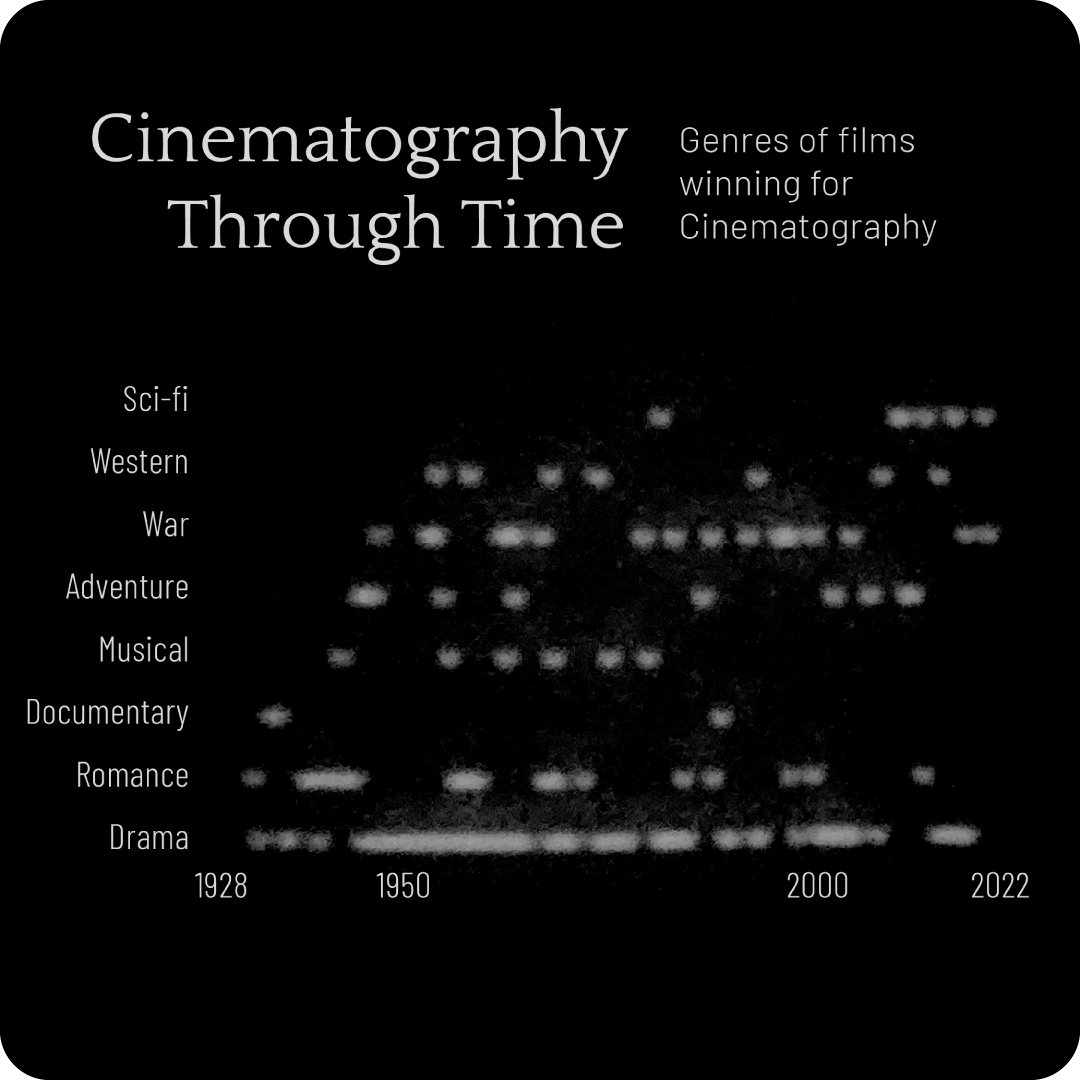
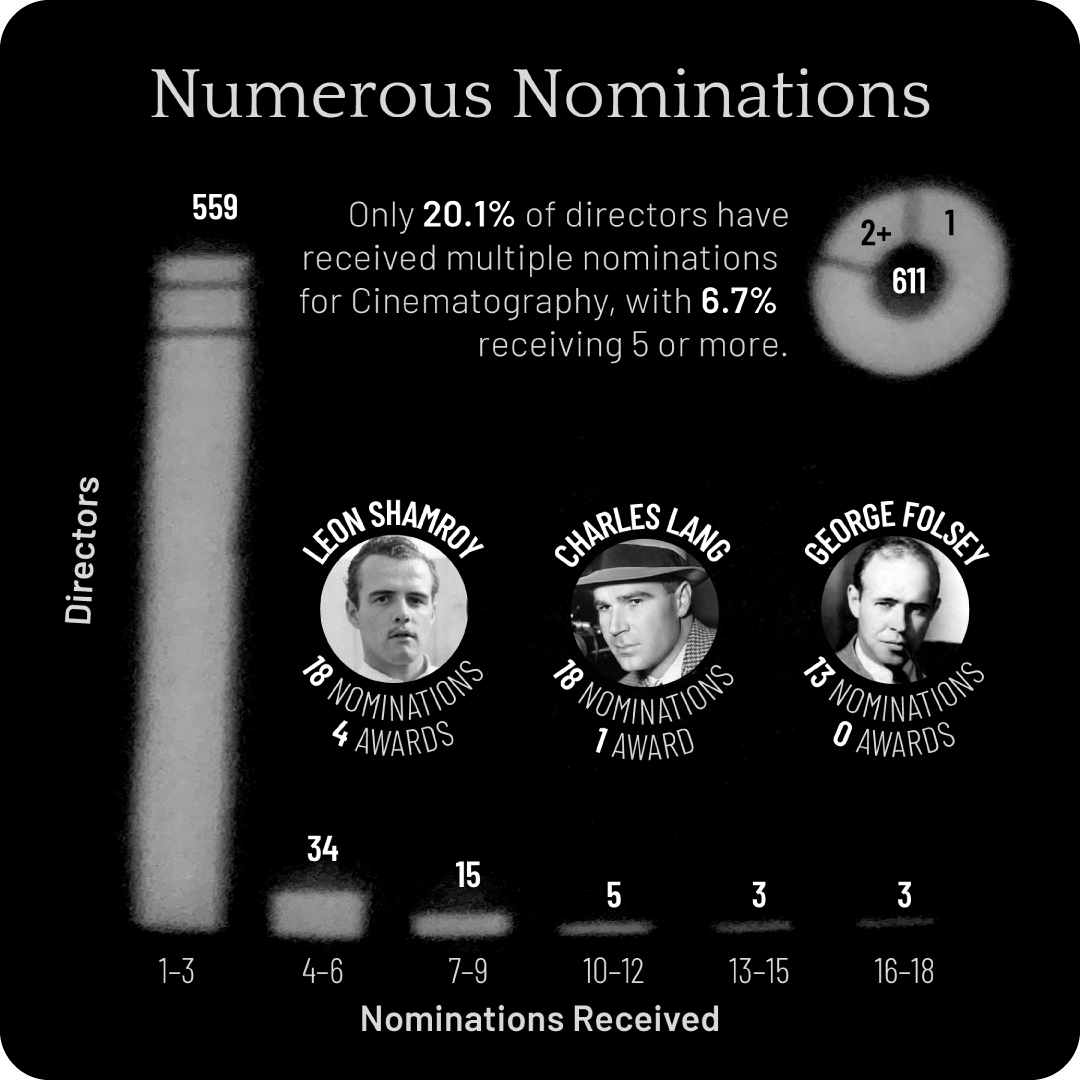
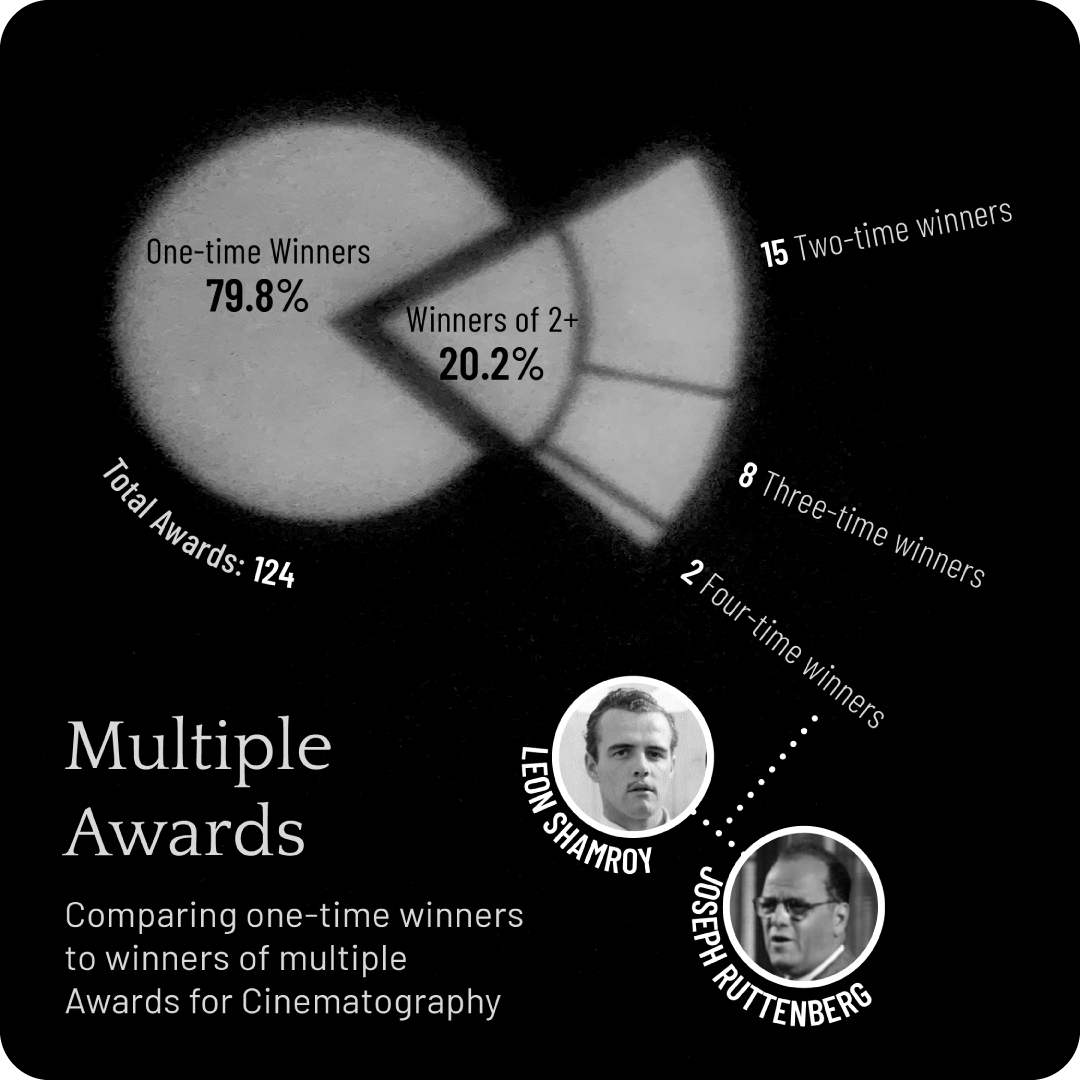
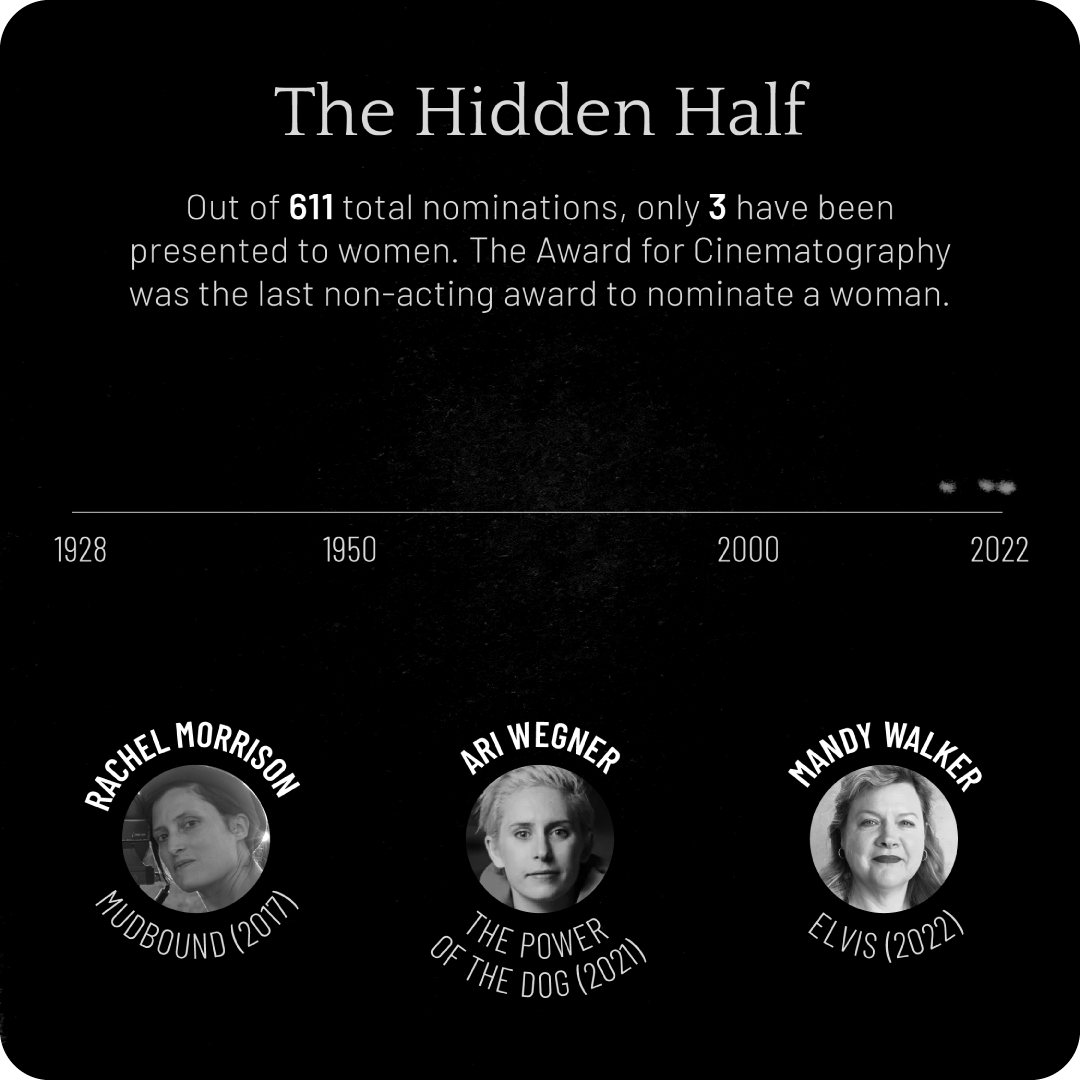
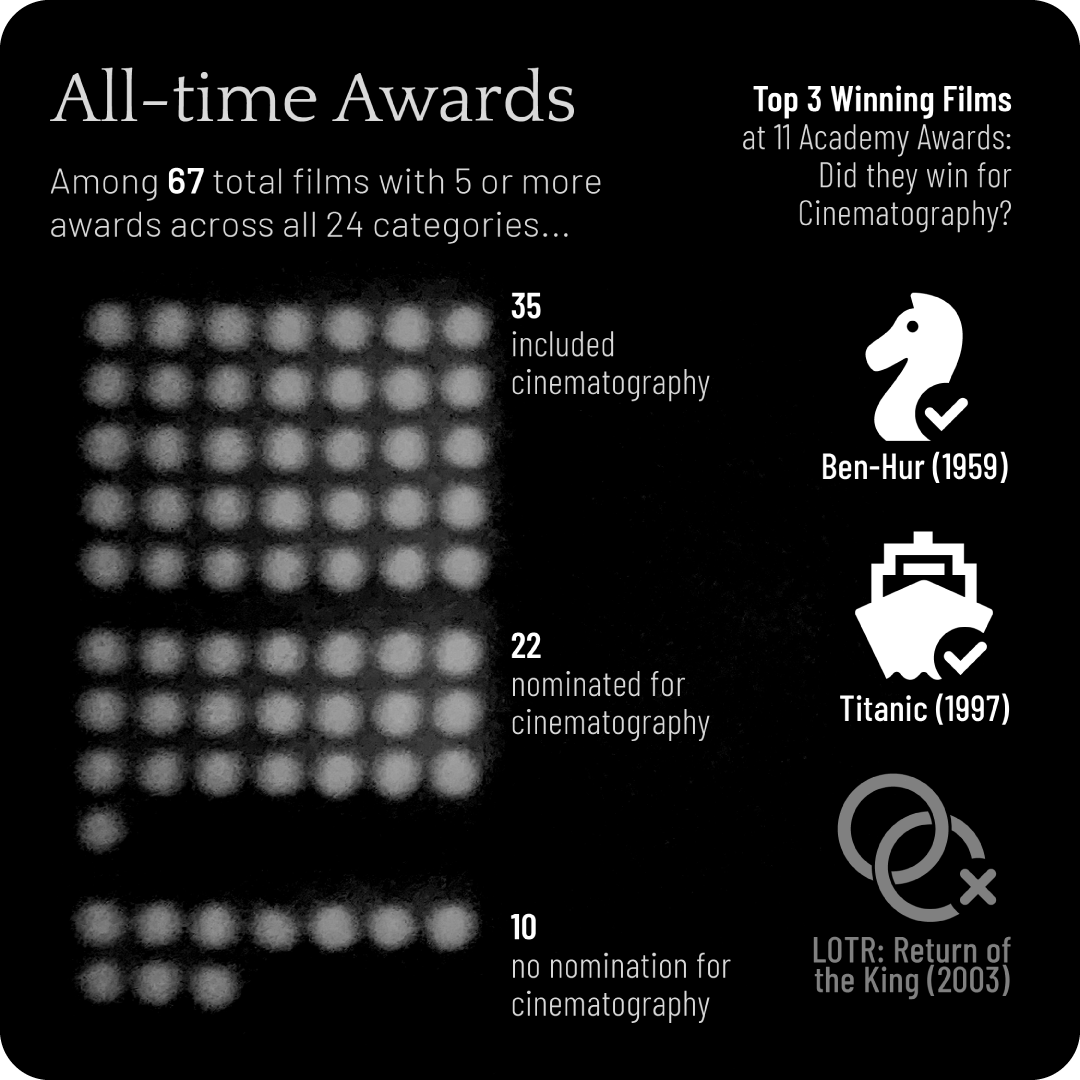
Propose a series of 5 infographics to be published as an Instagram carousel, whose topic pertains to the Oscars, Grammys, Olympics, World Cup, or Golden Globe Awards. The series must have a cohesive style and use some form of handmade, tactile art.
Approach
My data sets explore the topic of the Oscar Award for cinematography. My series alludes to the visual style of early films. To achieve this, I printed and cut out graphs I had made in Illustrator, projected a light through them, photographed the result, and toned the photos to increase clarity.
Tools
Adobe Illustrator, Google Sheets, Nano Banana, Adobe Lightroom

Infographic Redesign
Challenge
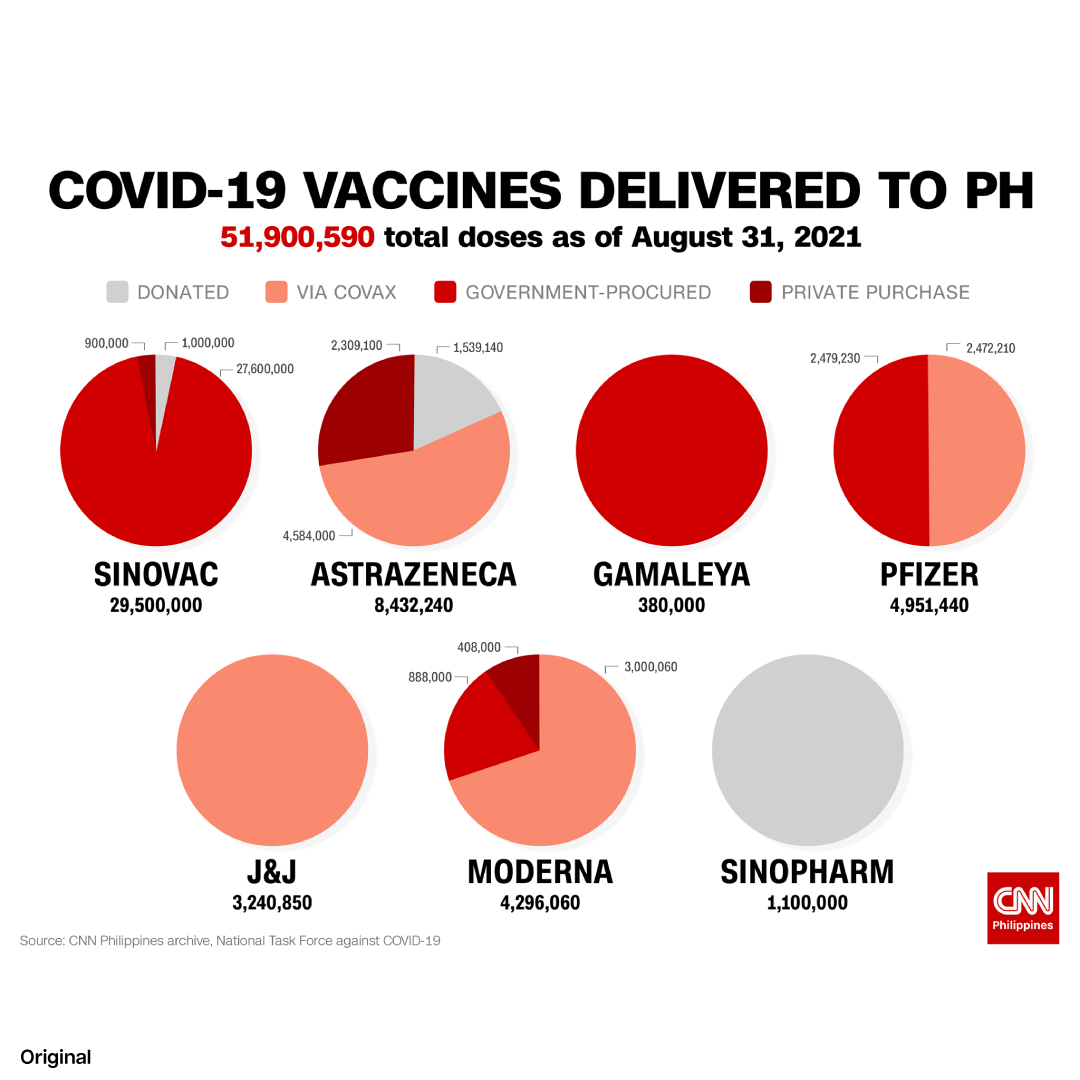
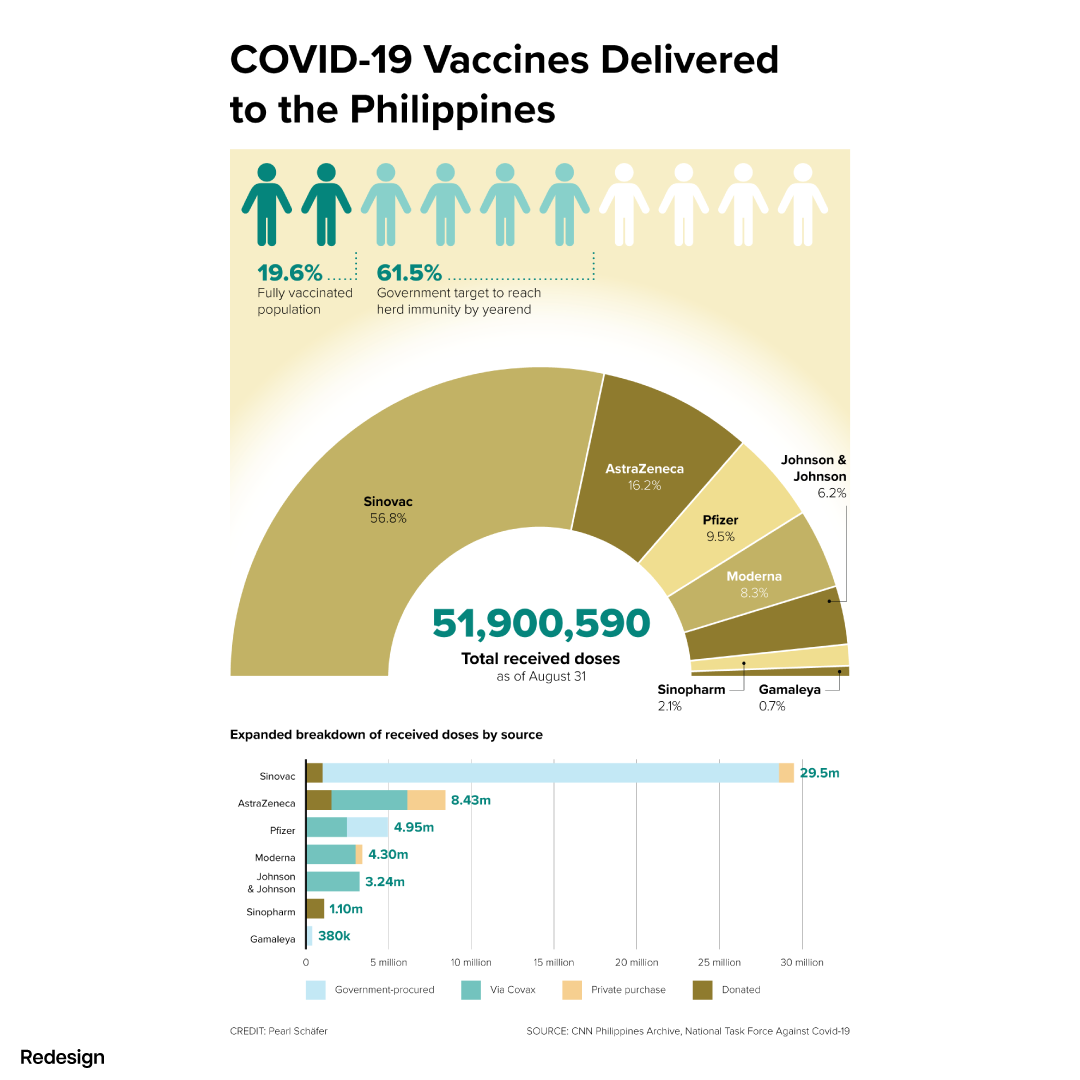
Redesign the given infographic on a 5x8" artboard. Include all text and use any fonts and colors to represent the data.
Approach
The pie charts are better suited for bar graphs since the data focuses more on comparison between categories rather than parts of a whole; the pie chart becomes redundant if each category amounts to 100%, and their equal sizes miscommunicate their sum totals.
I provided a half-donut chart for a grand sum comparison along with a bar chart which provides more detail and replaces the original pie charts.
Tools
Adobe Illustrator, Google Sheets